> restart;
Math B14-1
Finding Local Maxima and Minima
In Edwards and Penney, you will shortly study how to locate the tops of `hills' and bottoms of `valleys' for the graph of a function.
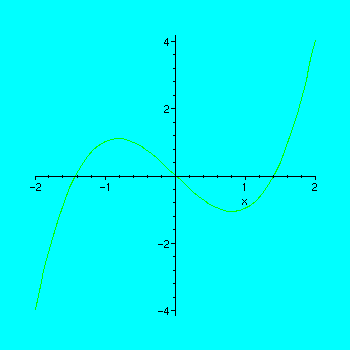
> plot(x^3 -2*x, x=-2..2);
>
In the graph above, there is a `hill' (also called a local maximum ) in the second quadrant and a `valley' (also called a local minimum ) in the fourth quadrant.
As you will learn in class, these points can be determined using calculus by noting that the tangent line at such points is parallel to the x-axis, so it has zero slope. In this wokrsheet, we want to study this same question by a graphical technique, and we want to look at some of the realistic problems that arise in complicated examples. Consider the function g(x) defined here:
> g:= x-> x^3-3*x^2 +1;
![]()
Plot it.
> plot(g);
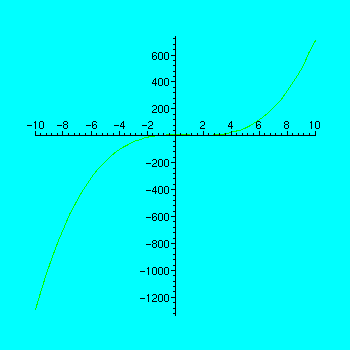
The default scaling does not give us a very good picture, but it appears that any interesting points will probably appear in the range x=-4..4 and y = -50..50. Let's replot the graph with those values.
> plot(g(x), x=-4..4,y=-50..50);
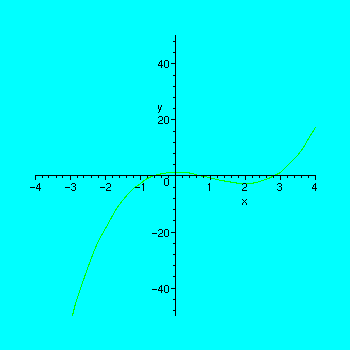
A local minimum seems to be about at
![]() . Let's focus in on it some more.
. Let's focus in on it some more.
> plot(g(x), x=1.9..2.1);
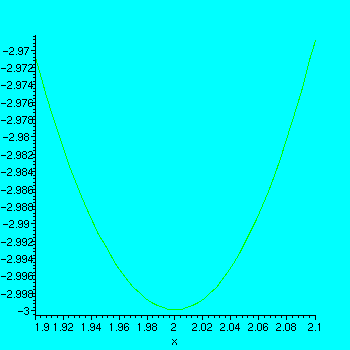
It appears we were right and there is a local minimum exactly at
![]() .
.
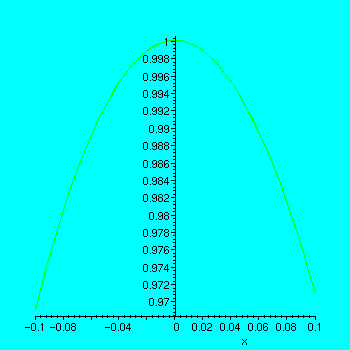
There also seems to be a local maximum at x=0. Let's check that out.
> plot(g(x), x=-0.1..0.1);
To find the local maxima and minima, by calculus, one sets the derivative of the function equal to zero. (This says that the tangent line has slope zero.) The derivative of a function
![]() is obtained by applying the `D' operator to the function.
is obtained by applying the `D' operator to the function.
> D(g)(x);
![]()
Set the derivative as a function of x equal to zero, and solve for x.
> solve(D(g)(x) = 0, x);
![]()
Homework
For the function f(x) defined below find approximate values for any local maxima and minima by graphing the function over different ranges. You will probably only be able to find them approximately. We first give an overall plot, and then specify some values of
![]() to plot between to look for potential maxima and minima. By varying
to plot between to look for potential maxima and minima. By varying
![]() and
and
![]() , try to focus in on the maximum and minimum points as closely as you can. Write your approximate answers directly on the worksheet (or if you feel ambitious, figure out how to type themin as text.)
, try to focus in on the maximum and minimum points as closely as you can. Write your approximate answers directly on the worksheet (or if you feel ambitious, figure out how to type themin as text.)
Find the location of the values of
![]() where the maxima and minima occur to at least two decimal points.
where the maxima and minima occur to at least two decimal points.
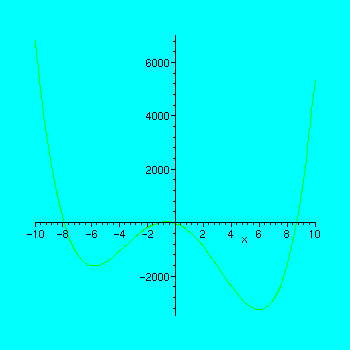
> f:= x->2*x^4 + x^3 -139*x^2 -174*x -54;
![]()
> plot(f);
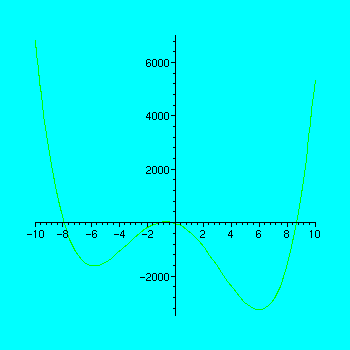
> a := -10; b := 10; plot(f(x),x=a..b);
![]()
![]()
>